Images
of Both WLC and MCE
WLC Tables (for running
MCE results)
Table 1. Applying the landuse_rescale_suit1
(is the same as the filename: landuse_suit1 in the cartographic model)
to factor weight.
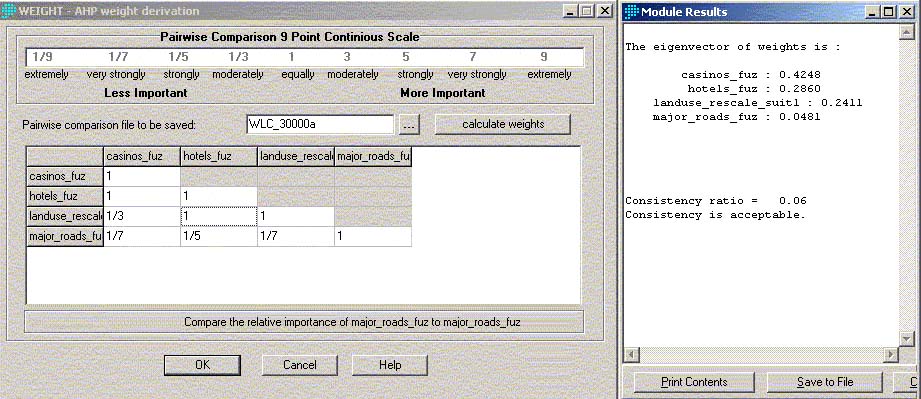
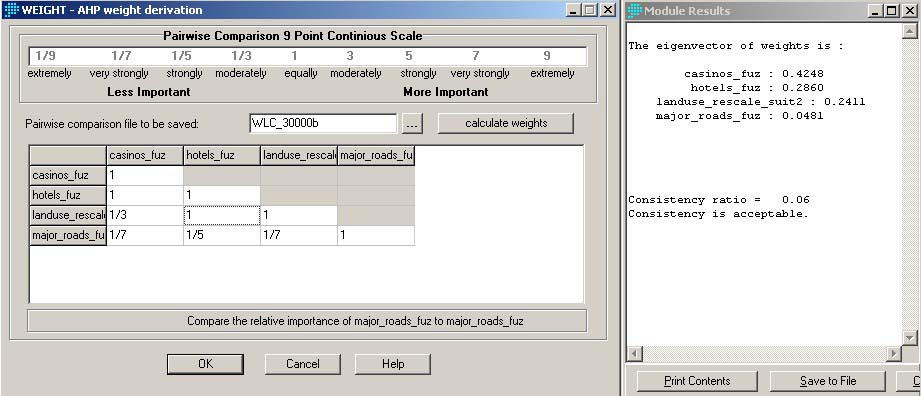
Table 2. Applying the landuse_rescale_suit2
(is the same as the filename: landuse_suit2 in the cartographic models)
for factor weight.
MCE Tables (for running
results)
Table 3. Applying both files of the average
income is less than $30000 and landuse_rescale_suit1 for MCE

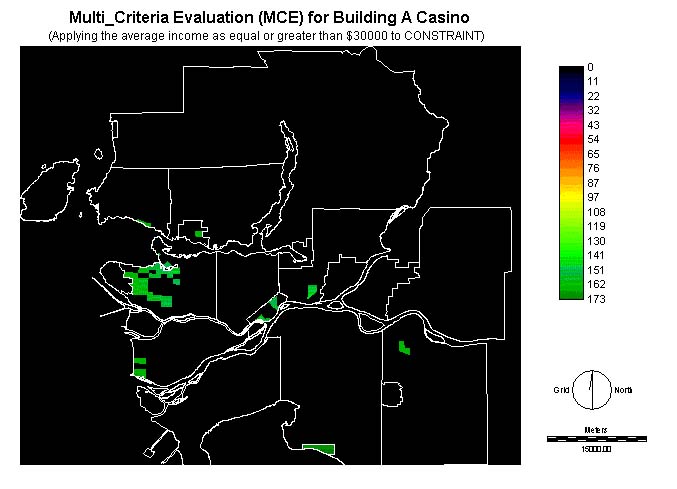
Table 4. Applying both files of the average
income is less than $30000 and landuse_rescale_suit2 for MCE
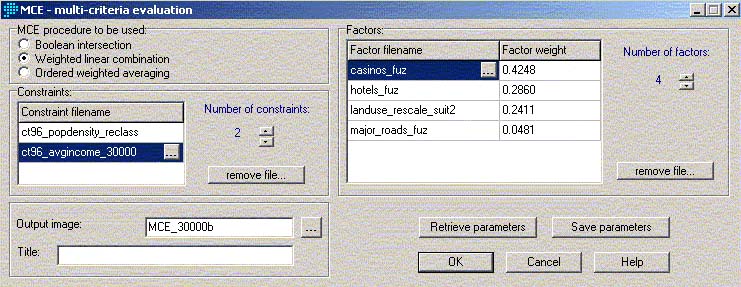
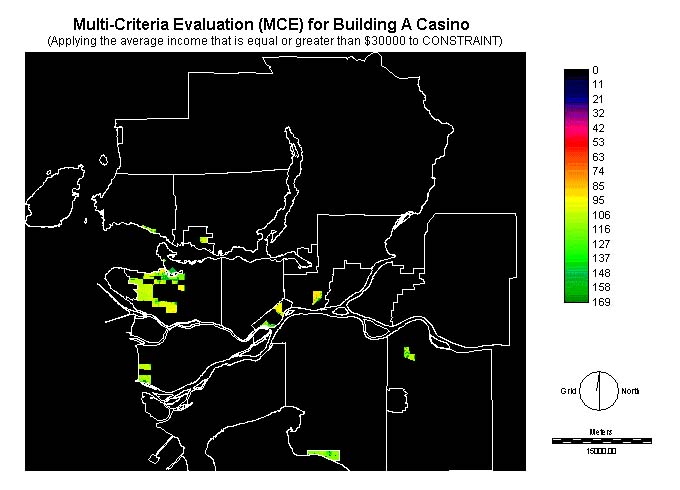
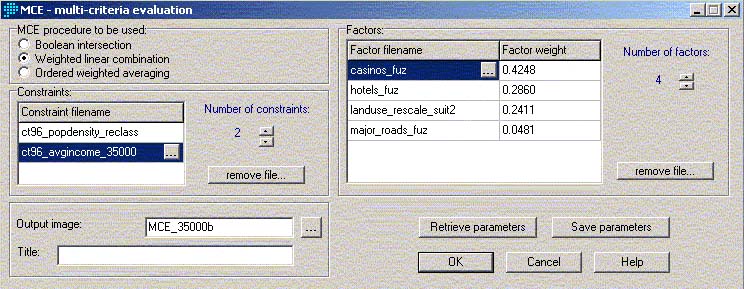
Table 5. Applying both files of the average income is less
than $35000 and landuse_rescale_suit1 for MCE
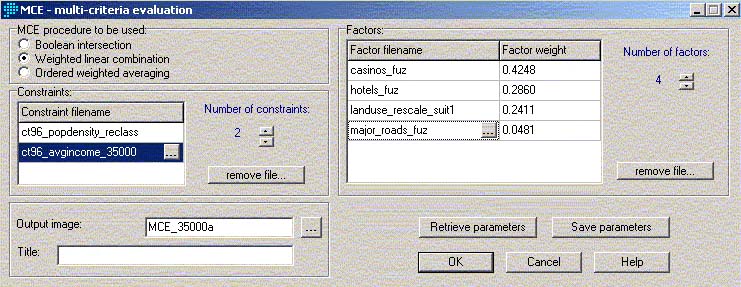
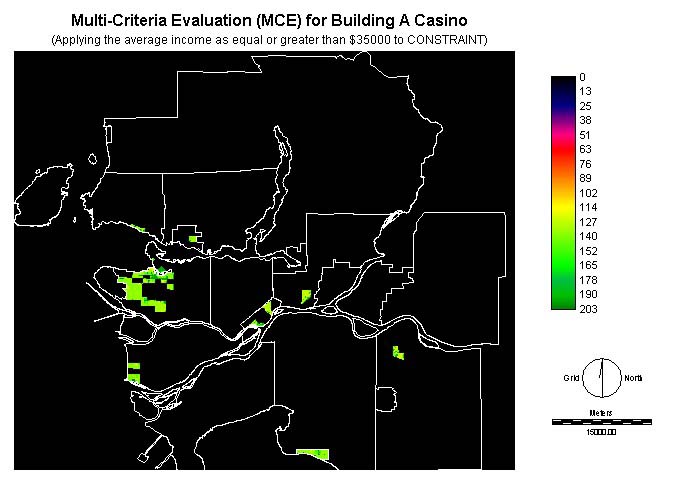
Table 6. Applying both files of the average income is less
than $35000 and landuse_rescale_suit2 for MCE
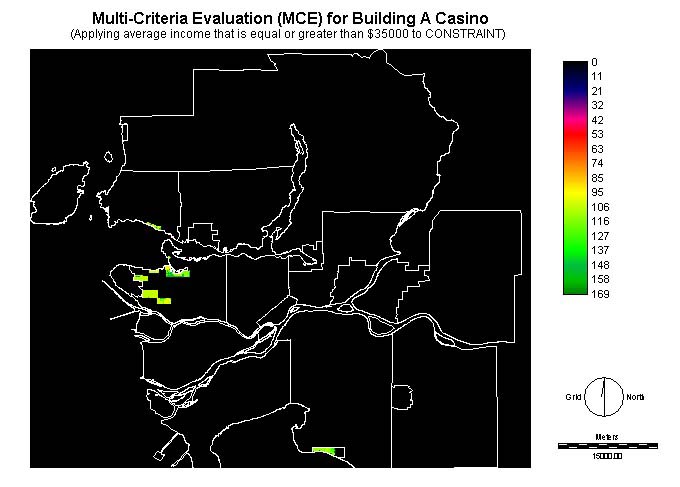
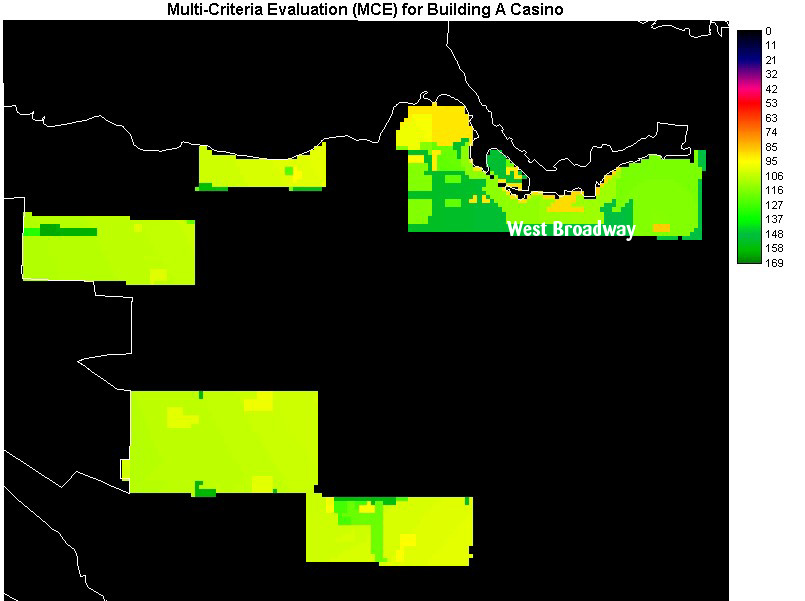
Final Result
The image is zoomed to the place on West Broadway between Main and
Granville Street.