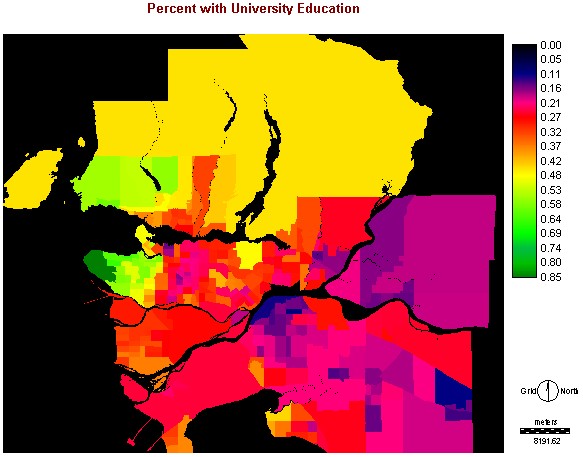
2. University Education - based on total population
15 years and over (20% sample data)
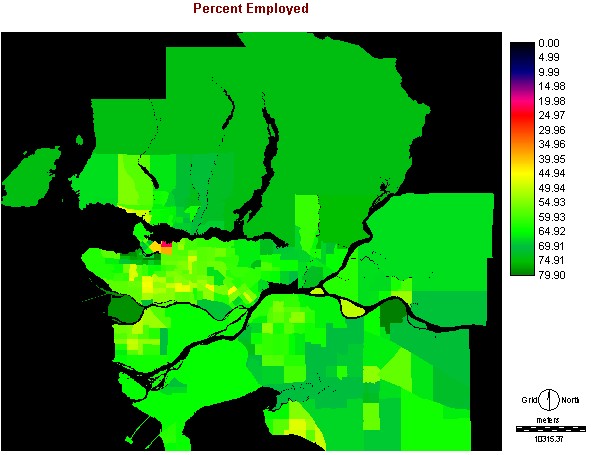
3. Percent employed - based on total population 15 years and older (20% sample data).
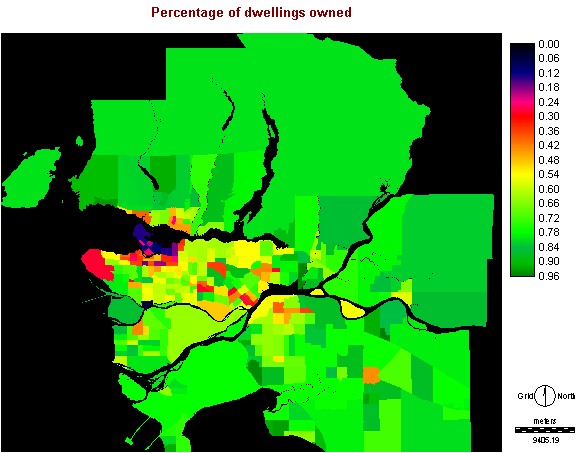
4. Percentage of dwellings owned - based on total private owned dwellings (20% sample data)
My Constraint: The location of those with 'good health' would live within 2km from a park.
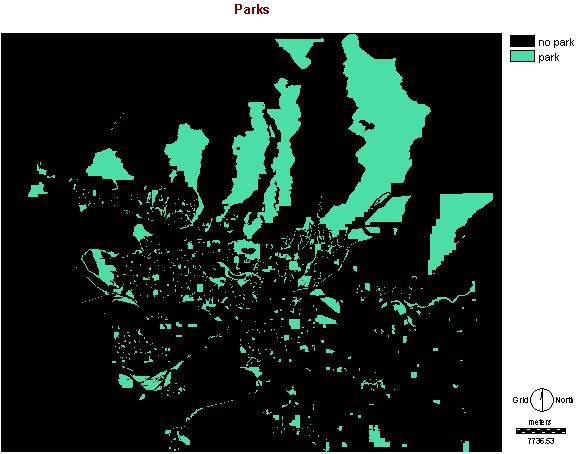
First of all I had to reclassify LANDUSE into PARKS which gave me this first boolean image:
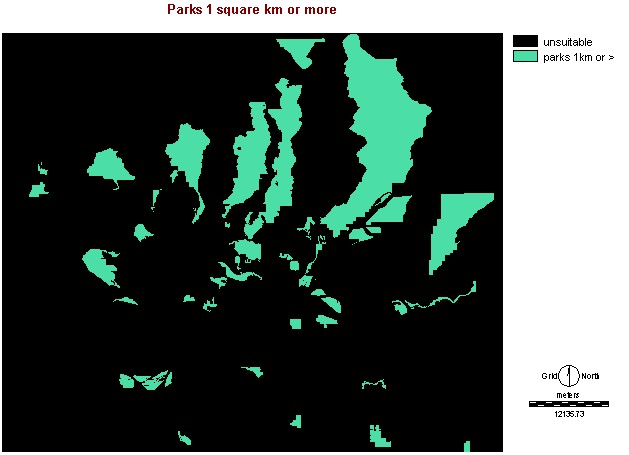
Then I decided that park should be at least one square kilometer in order to encourage adequate physical activity. To do this I ran group and then area on my image to obtain parks with such criteria.
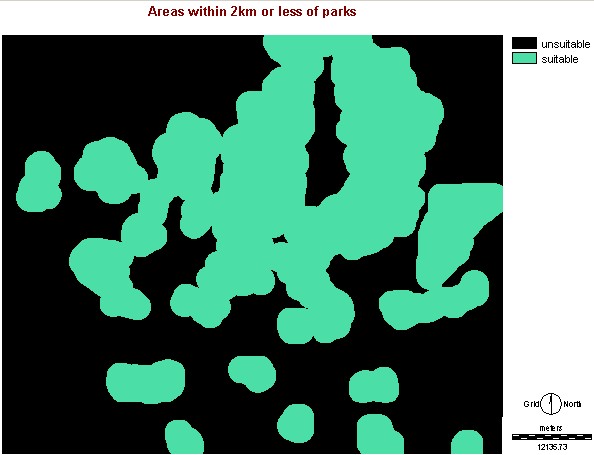
Finally, I buffered the image to include those areas that are within 2km of a park. This criteria was important because living in proximity to a park facilitates exercise.

3. Percent employed - based on total population 15 years and older (20% sample data).

4. Percentage of dwellings owned - based on total private owned dwellings (20% sample data)

My Constraint: The location of those with 'good health' would live within 2km from a park.
First of all I had to reclassify LANDUSE into PARKS which gave me this first boolean image:

Then I decided that park should be at least one square kilometer in order to encourage adequate physical activity. To do this I ran group and then area on my image to obtain parks with such criteria.

Finally, I buffered the image to include those areas that are within 2km of a park. This criteria was important because living in proximity to a park facilitates exercise.
