.jpg)
Essentially, there were three variables that related to crime that needed to be manipulated. The three variables, again, are parks, skytrain and rail routes. Firstly, these files needed to be converted from ArcView to the IDRISI format. After that was completed, I loaded up the vector files into IDRISI and examined their spatial relationships. This is what each variable, including crime locations looked like:
The road network was displayed as a background layer in order to give the data a familiar spatial orientation.
PARKS:
.jpg)
SKYTRAIN:
.jpg)
RAIL:
.jpg)
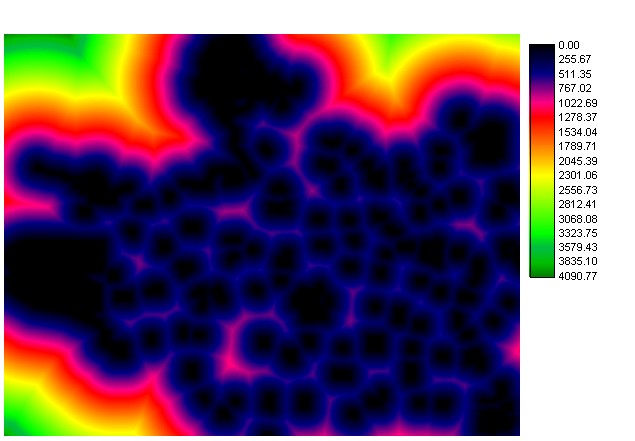
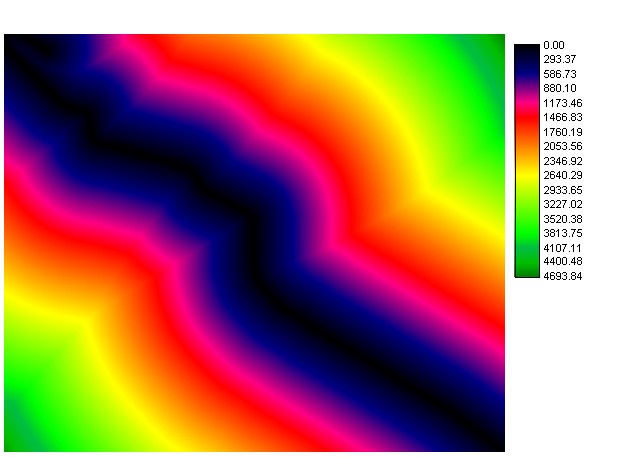
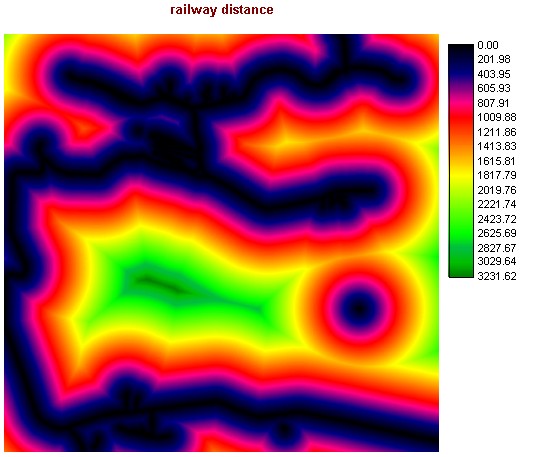
After... these files were analysed with a distance operator and a buffer of 500m was set around these entities. The resulting distance weighted images looked like this:
PARKS:
SKYTRAIN:
RAIL:
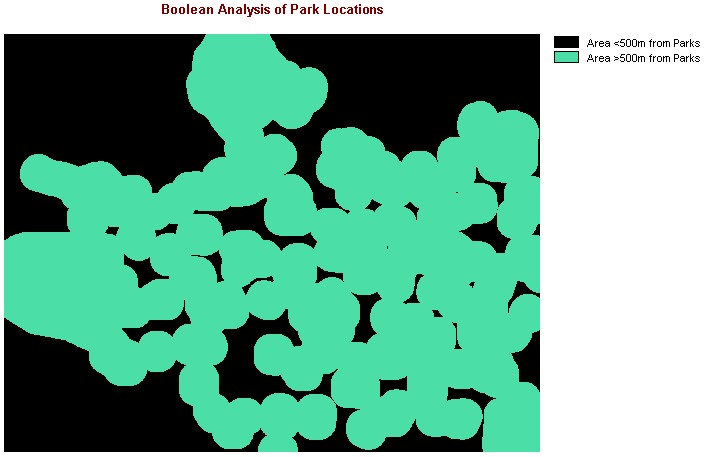
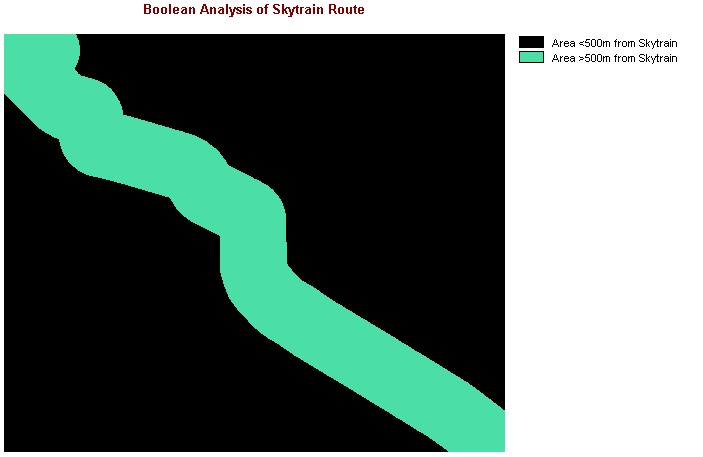
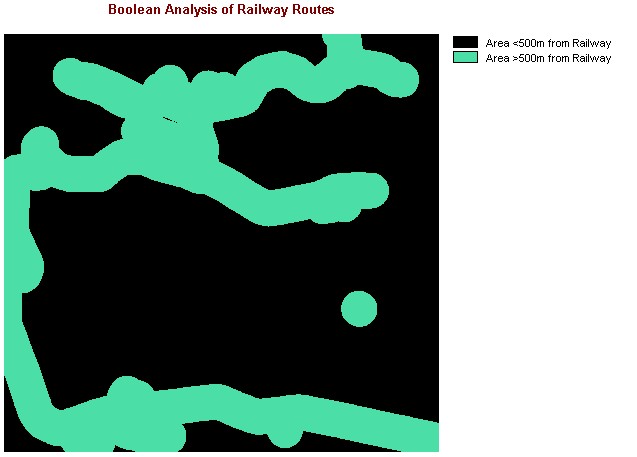
Lastly, these distance weighted analyses were converted into Boolean images.
PARKS:
SKYTRAIN:
RAIL:
These three Boolean images were used in a Multi-Criteria Evaluation, and used with a fourth and most important variable of crime locations.
Crime locations in Vector:
.jpg)
Crime locations when converted
to Raster:
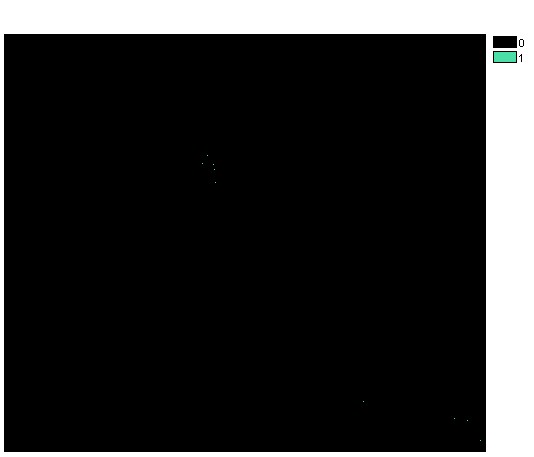
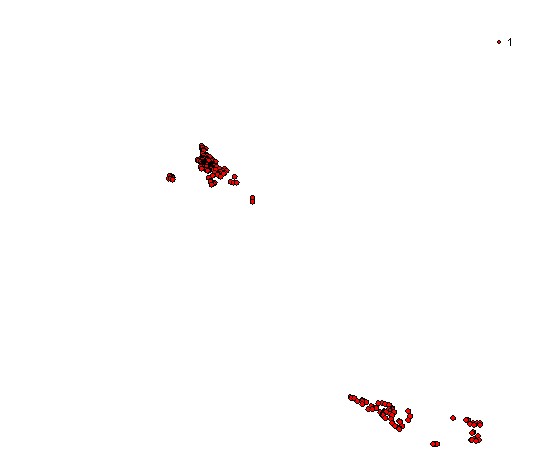
The resulting image looked like this and was consequently converted back to Vector format
Original Raster image
Converted Vector image:
When I finished with this,
I overlayed three vector layers(parks, skytrain and railroutes) for
spatial orientation.
This is what the final product
looked like:
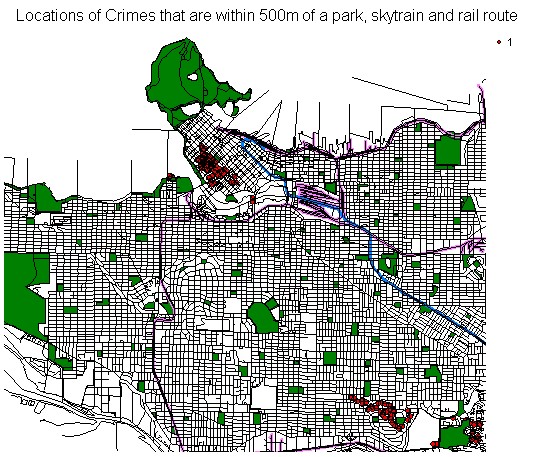
These crimes are mostly located
around a 7 X 10 block area in the downtown Vancouver region,
and also in the southeast
Vancouver region near Boundary Rd and SW Marine Drive.
This analysis clearly gives
us more information than we originally started with. If given a hypothetical
situation in which there was specific instances of crimes happening in
parks, and that the known transportation medium by the criminals was by
rail or skytrain, then this analysis would be able to provide the Police
with accurate inferences on where to focus their patrol efforts around.