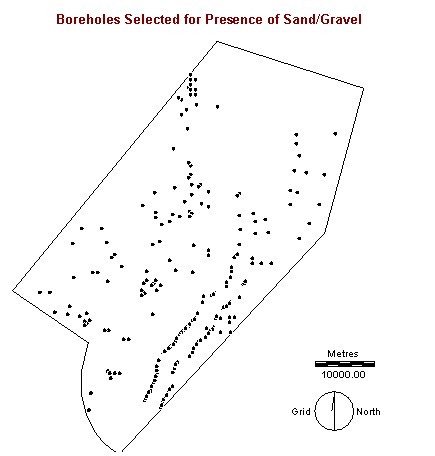
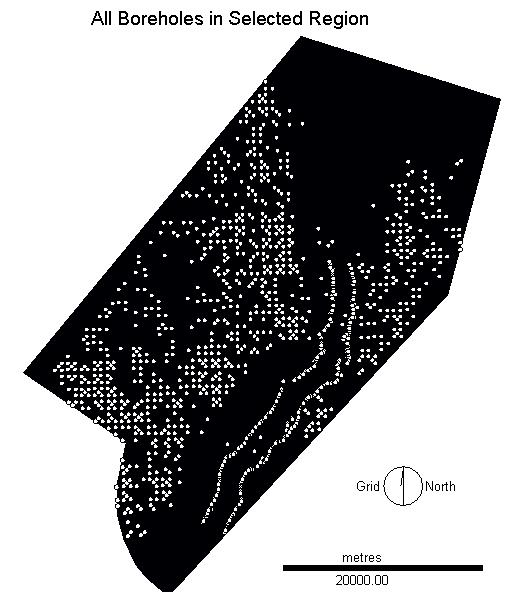


Above is shown the distribution of the boreholes selected for sand/gravel and the distribution of all of the boreholes in the study area. Upon primary examination one can see that for the most part the distribution of selected boreholes follows the distribution of all of the boreholes. This made an analysis incorperating data density and proportion of selected boreholes necessary.
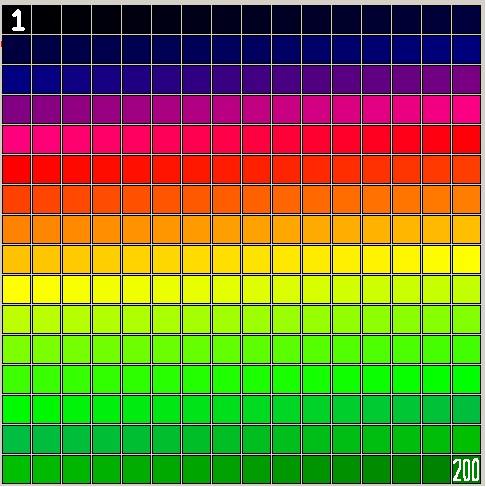
The above pallette was used in displaying the results
of the Multi-Criteria Evaluation. With suitability increasing from 1-200.
Trial 1:
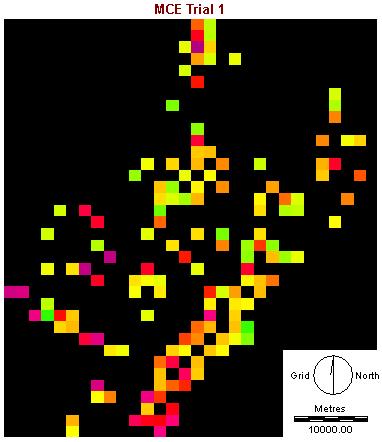
In the above display one can see that the most likely
areas where active transport occured were in the upper-central part of
the area, trending up to the north-west. This is consistent with the hypothesis
proposed. One interesting result is the relatively low values in the lower
right hand portion of the display. Data in this area is very dense and
these lower values may indicate that although boreholes with gravel are
present, they do not represent the same importance as indicators of transport
as those to the north. Because the highest weight was accorded to the thickness
value, this result can be thought of as reflecting the influence of thickness
more than the other factors.
Trial 2:
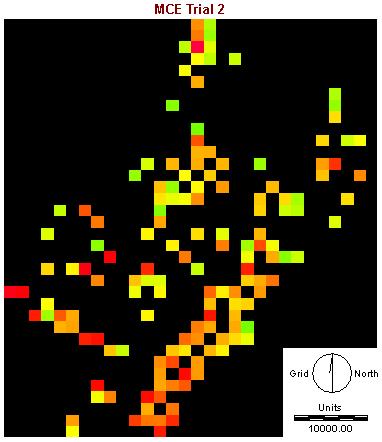
The second trial gave much the same results as the first,
showing that thickness may not have as large an influence as other weighting
factors.
Trial 3:
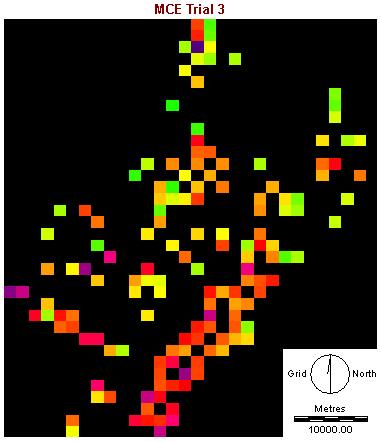
The third trial was weighted more heavilly towards the
proportion of boreholes containing sand/gravel. Where the proportion is
given the greatest weight, one can see that the areas with the densest
data in the bottom right have relatively low values. Again the pattern
of high values in the upper portion of the area are seen. High values again
seem to trend to the west-north-west in the upper portion of the display.
In all three trials, clear patterns
are difficult to discern but one can see that where the point display shows
dense concentrations of boreholes with sand/gravel in two lines in the
lower right portion of the area, once other factors are weighed, these
areas don't have as high a suitability as others. A trend of increasing
suitability to the north versus the south may reinforce the hypothesis
that gravel was transported from the north-west.