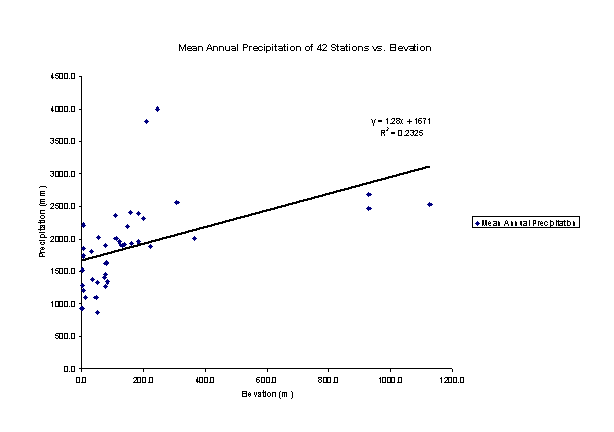
Figure 5:
Plot of mean annual precipitation and elevation of 42 stations.