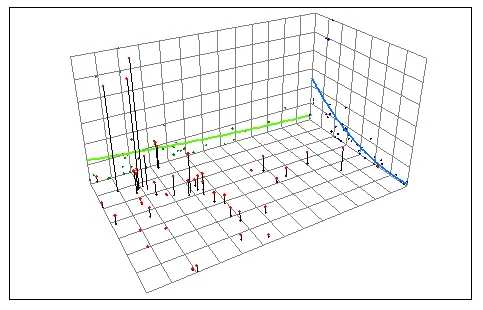
Figure 22: Orthogonal trends in elevation of precipitation stations. By rotating the locations, one trend is reduced to almost zero, maximizing the trend in the perpendicular direction. This shows that the axis of maximum variation differs slightly from the north-south axis. Stations are displayed according to their spatial distribution. The green line represents the East-West trend and the blue line show the North-South trend. The red dots are the stations and their elevation is represented by their height above the plane.