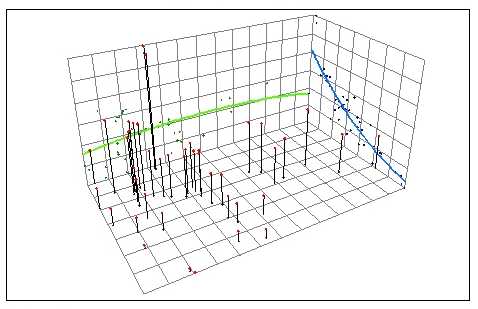
Figure 21: North-South and East-West trends in annual precipitation Stations are displayed according to their spatial distribution. The green line represents the East-West trend and the blue line show the North-South trend. The red dots are the stations and their elevation is represented by their height above the plane.