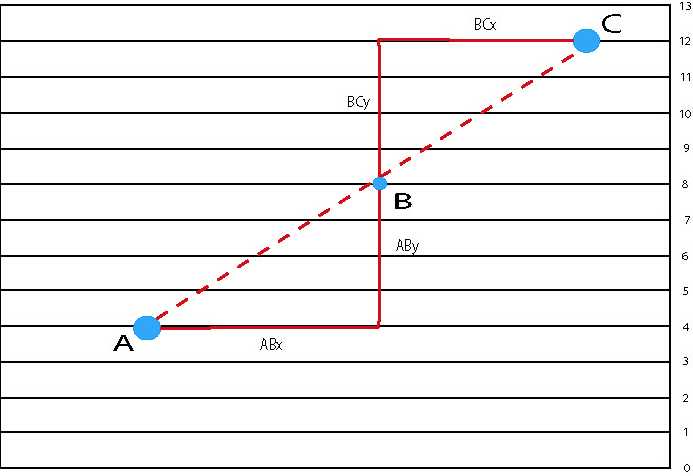
Figure 19: A hypothetical planar surface on which there is a perfect correlation between elevation and precipitation. As a result the horizontal isolines represent increasing elevation and increasing precipitation. Points A and C are known stations. Point B is exactly half way between the two stations. This illustrates that the only distances necessary for the interpolation of precipitation at point B are ABy and BCy. It is not necessary to consider distance along the x-axis.