Spatial Analysis -- Field Study & Secondary Anlysis
Field Study:
The purpose of this field study is to randomly screen the accuracy of the walkability score we computed through primary analysis and to rank them from the perspective of our group to compare the differences or similarities between the two.
For the field study, we randomly selected ten postal codes as our samples using stratified sampling in Microsoft Excel. There are two strata: one is walkability including the VANDIX as a factor, and the other is walkability without VANDIX as a factor. Since our walkability scores are classified into 5 ranks, we picked one postal code from each of them. This process was repeated twice in order to ensure the randomness of the samples.
The samples selected are well distributed over the GVRD. Since the destinations are so dispersed, our information collected from the data can be less biased and more precise.
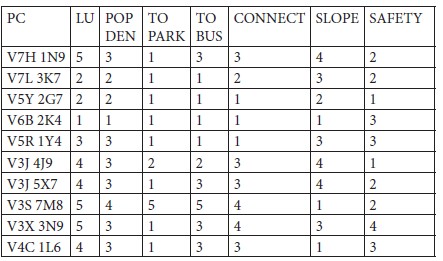
The following table shows the result of our field study:

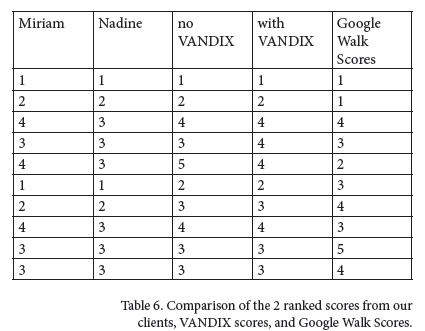
The feild study results were compared with the walkability values originally generated in the ten postal codes in our primary result. The scatterplot shows the ten postal codes plotted according to their scores both from the fieldwork and the primary result we produced use ArcGIS.

Secondary Anlysis
Secondary analysis considered the following factors towards a final output map:
- the walkability factors (land use, slope, distance to parks, distance to bus stops, connectivity and population density)
- with and without socioeconomic status (measured by VANDIX)
- adjustment of weighting and ranking of the above two factors by Dr. Nadine Schuurman and Dr. Miriam Rosin.
We use VANDIX to represent the local Socioeconomic status(SES) and study how much SES influences walkability:

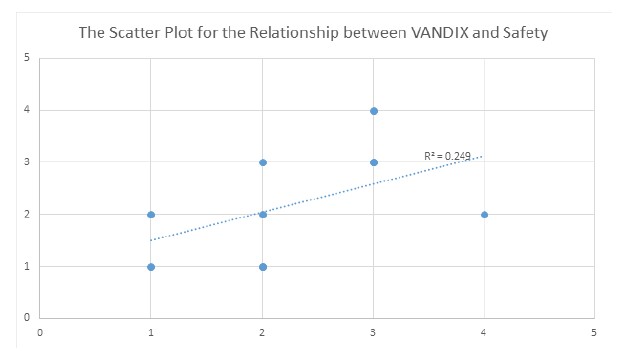
The secondary analysis also aimed to study the relationship between VANDIX and safety in postal codes. Therefore, we included “safety” in our categorization for the grading scheme. Subsequent research attempted to find whether there was a correlation between our perceptions of safety and VANDIX.

Secondary analysis also compared the final analysis of the walkability score with the Google Map Walk Score, as well as against the analyses that use Miriam and Nadine’s weights. Google Map Walk Score uses an algorithm that is primarily based on proximity to any commercial building and does not consider the type of commercial outlet within proximity.

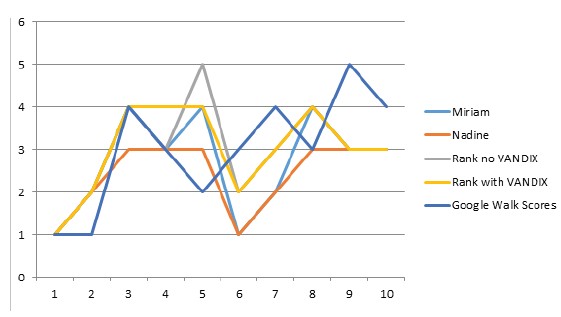
Chart representing the above score:
