 Composite
Images are created out of up to three bands of satellite imagery, which
are applied to the RGB-colour scheme to make fullest use of the capabilities
of the human eye. Notably true colour (red, green, blue bands) and
false colour (any combination of bands other than the previous) composite
images are useful. Composite
Images are created out of up to three bands of satellite imagery, which
are applied to the RGB-colour scheme to make fullest use of the capabilities
of the human eye. Notably true colour (red, green, blue bands) and
false colour (any combination of bands other than the previous) composite
images are useful.
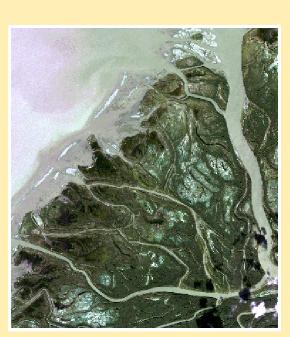
The true colour composite (see above) of the
Slave River was used for main parts of the visual analysis and as a background
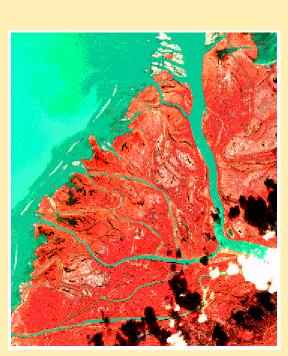
picture for defining training sites. The false colour composite image
(green, red, near infrared bands - see right) of the study area served
not only visual interpretation purposes but also as an input image in the
unsupervised classification.
Since intercorrelation between bands,
and thus data redundancy, is often the case with remotely sensed data,
Principal
Component Analysis is designed to reduce or remove such redundancy
(Kiefer and Lillesand, 1994, pp 572-573). By examining the four
component images, it is obvious, that the first two principal components
are able to explain virtually all of the original variability in reflectance
values. By zeroing out the coefficients of the noise components in
the reverse transformation, new version of the original bands were produced,
and a composite image was created, to deepen our knowledge of the scene.
This image was also used for an unsupervised classification, which showed
the difficulties related to the undistinguishable classes.
That fact was also supported by the Scatter diagram
of the near infrared and the red band. The scatter diagram was also
used as a means to compare the relationship of signatures in relation to
their bands.
|
Development of Training Sites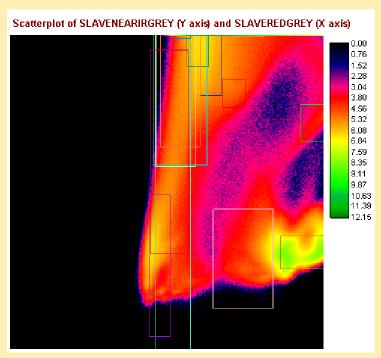
The development of training sites was both an
art and a science (Kiefer and Lillesand, 1994, p 596). The overall
objective of the training process was to define the spectral response patterns
for each land cover type to be classified in the image. This was
accomplished by using the ground truth data from the vegetation map from
1979. To define the precise outline of each vegetation class we also
used the false colour aerial photographs, viewed with a stereoscope.
The training sites were digitized on-screen, and then transformed into
signatures, which carried the information contained in the remotely-sensed
images. The final signatures were plotted on the scatter
diagram, each rectangle representing a training site. Thus, the
quality of the training sites can be evaluated by examining their match
to the 'clusters' in the diagram. A further assessment of the training
site quality was performed by comparing the signatures created out of the
training sites. Therefore, the mean reflectances of the spectral
response patterns are compared and coincident mean plots of training sites
are re-defined.
Image Classification Methods
Image classification is the computer-assisted
interpretation of remotely sensed imagery that follows the visual interpretation
(Eastman, 1999, p 37). Two distinct methods were used to classify
the satellite imagery supervised and unsupervised classification.
The underlying objective was to compare the characteristics of the different
classification techniques, and to evaluate the results of the general trends
of changes in vegetation. The data input was either the red and near
IR band or the false colour composite or both. In all cases, we needed
to reclass the resulting images according to our ground truth.
Unsupervised classification is
used to uncover the commonly occurring land cover types, which have to
be interpreted and assigned to the known plant assemblages based on ground
truth. The general spectral response patterns of the unknown pixels
were compared and grouped into clusters of the major land cover classes,
which are represented in the final image. This has the advantage,
that initially not apparent classes might be revealed, and the choice of
the training sites is supported by using the results of an unsupervised
classification (Gibson, P. J. et al., 2000, p 77 - 78).
We followed two different approaches, one technique
called Cluster and the other Isoclust (iterative self-organizing cluster
analysis), which 'combines' supervised and supervised classification -
it uses the near IR and the Red band as well as the false colour composite
image (see Map Gallery).
In Supervised Classification it is necessary
to define training sites; numerical descriptors of the various land cover
types present in a scene are specified to the computer algorithm, (Kiefer
and Lillesand, 1994, p 586). In performing the classification procedure,
each pixel in the image data set is categorised into the land cover class
it most closely resembles. This is followed by an iterative process of
re-evaluation and changing of the training sites.
In the Minimum-Distance-to-Means classification,
each pixel is assigned to the class with the mean spectral value, in each
band for each category, closest to the value of that pixel. Both,
raw and normalised distances were used to compare the results.
The Maximum Likelihood classification is based
on Bayesian probability theory (see Eastman, R., 1999, vol.2, p 40 41
for further information). Each pixel's posterior probability of belonging
to each class is estimated by using the mean and variance/covariance data
of the signatures derived from the training sites. The outcome can be conceptualised
as an elliptical zone of characterisation of the signature. This reduces
the possibility of overlaps between different classes (see Map Gallery).
|