| In each case, the data is stored in vector coverage
(point coverage) of Maui_Beaches.vct
Before any analysis, create attribute value file
for each attribute. For example, the attribute value file for board-surfing
was exported from database workshop (the first
field is IDRI_ID, and second field is Board_Surfing ).
This board_surfing.avl file allows to assign
appropriate values to each point feature from the point coverage during
interpolation process. This is analogous to using spot heights when
interpolating a DTM.
|
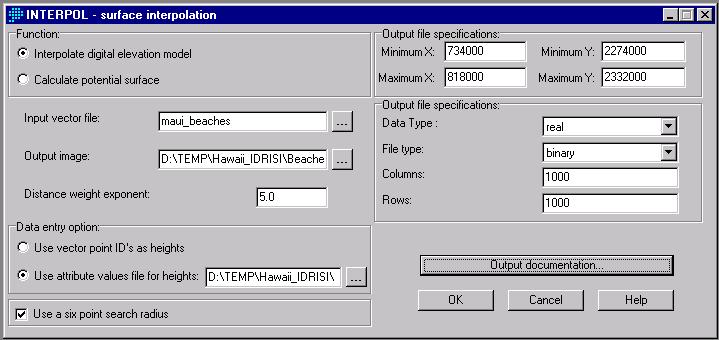
| Use surface analysis INTERPOL, creating new image
file for ouput, distance weight exponent of 5.0 (to make peaks small),
use attribute value file for heights, output data type Real, 1000 x 1000
raster image, and adjust output file extent by 5000 m in every direction.
Use larger bounds for output raster image than input image (extrapolate
a little - helps in visualization). To be consistent, use the same
x,y extent for each raster image from this process:
|
| To display results, each image was multiplied
by an image of coastlines where land surface of Maui and a buffer around
coastline (inclusive) has cell values of 1 and over ocean surfaces away
from land cell values of 0. This overlay operation results in the
ocean surface with values of 0 and can be assigned background color for
display. This image is then combined in a map composition with a
vector layer for coastlines and solid fill for land surface. In result,
only a narrow band of area outside the coastline remains with values from
the analysis, showing more realistic results.
The overall cartographic model is:
|
Fore each beach attribute,
click on attribute to view
image with results of analysis
|
Description of results
|
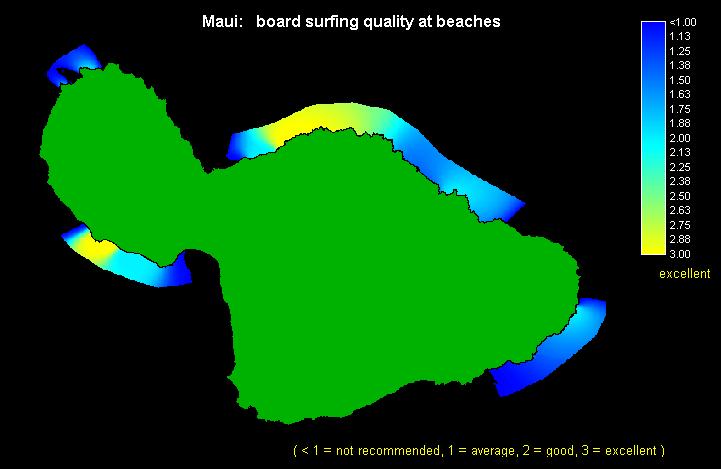
| Board-surfing
(surfing) |
The best board surfing is on the
north shore, just east of Kahului. Other good spots are in N.W. part
of the island, and south-west of Lahaina. Most of the coasts are
inaccessible or too dangerous for board surfing. However this analysis
includes only surfing spots near beaches, so there should be more surfing
areas than shown in this map. |
| Body-surfing (boogie boarding) |
(have data but not analysed - similar
to swimming and surfing attributes) |
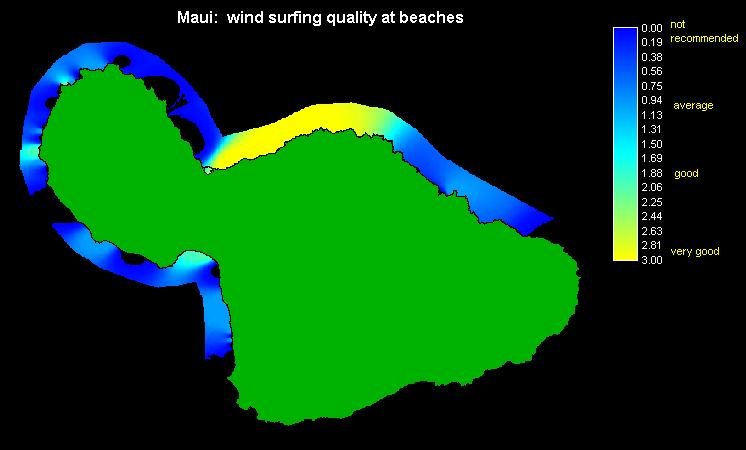
| Wind-surfing |
The only good spot for windsurfing
is north and east of Kahului. It is possible to windsurf at other
locations but it is far worse there. |
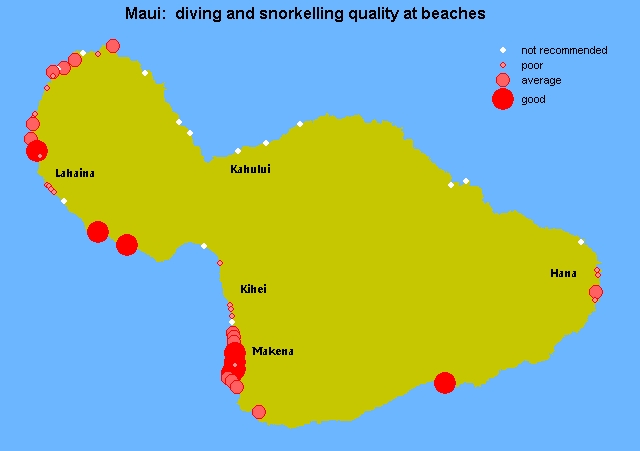
| Snorkelling
/ Diving |
This distribution is highly variable
and specific to each point feature on the coast. Interpolation for
coastlines does not make sense here. Instead, use graduated-point
symbol map. |
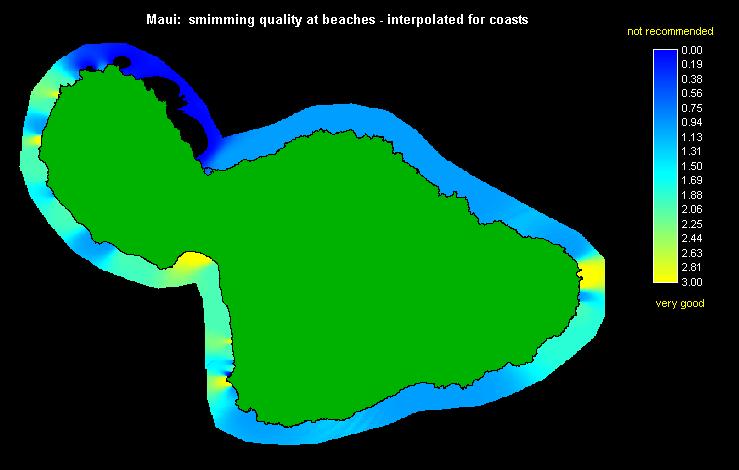
| Swimming |
Swimming is best on west coasts
of Maui and near Hana on east coast. |
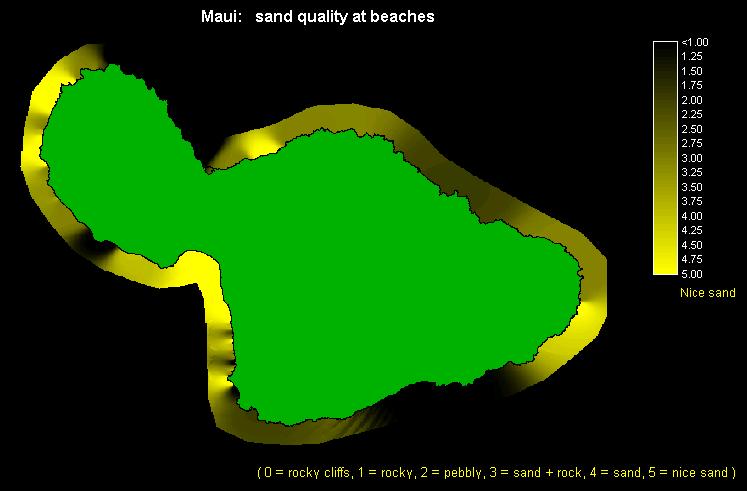
| Sand quality |
This map is a good approximation
of sand quality of Maui coastlines because sand occurs only on beaches.
The best sand is found where most tourist resorts are found, which is in
the south-west part of the island. |
| Water quality |
(not analysed - most beaches similar) |
| Storm wave height |
(not analysed - some inconsistencies
- waes high at most beaches during storms) |
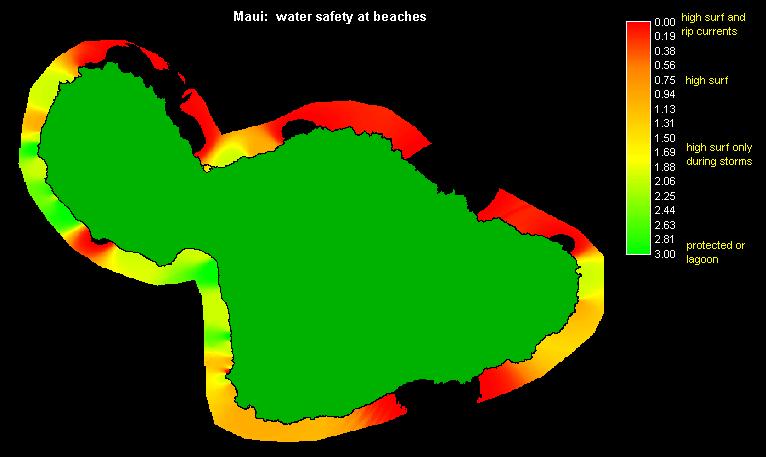
| Water
safety (surf break, waves, currents) |
The safest shores tend to be on
the south-east coastlines where wave action is much less than on the north
shore. Some beaches are more protected than others. |
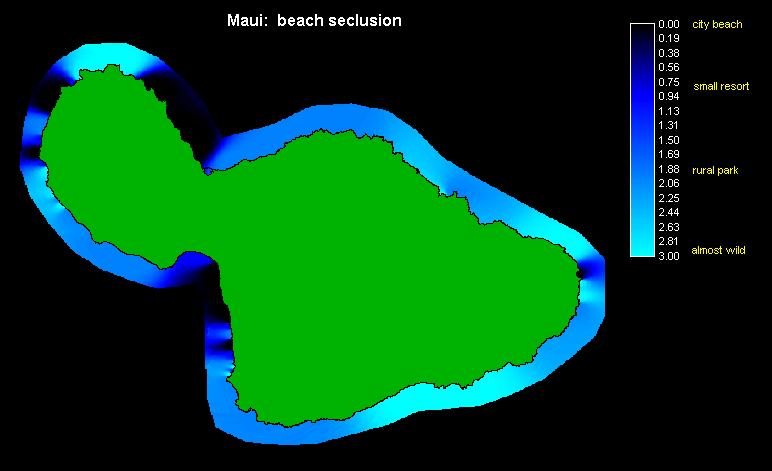
| Seclusion
(city beach to wild beach) |
Almost the opposite of beach access,
but there are exceptions. |
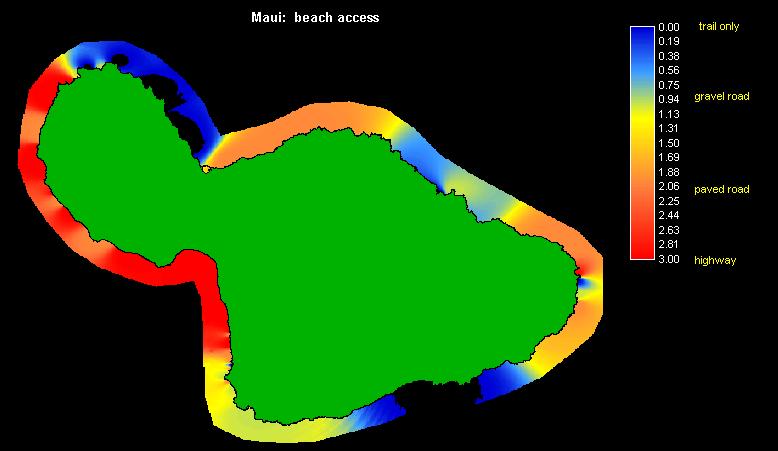
| Access
(trail, dirt road, road,highway) |
This is an excellent image that
shows the accessibility of beaches on Maui. |