Geog 215:
Introduction to Biogeography
The future character of a plant community can be approximated from the population structure of the individual species, but this technique may not reveal some of the inherent variations that may be expected to occur in an area. Simulating future forest succession on the basis of individual species replacement probabilities provides a more realistic approach to the problem. This method was developed by Henry Horn, and assumes that the probability of replacement of a canopy tree is a simple function of the relative abundance of species of saplings beneath that tree. That is, all saplings beneath the canopy of an individual tree have an equal chance of dominating in the gap that is created when the canopy tree dies.
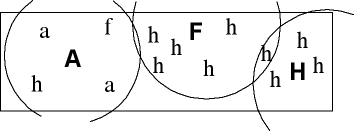
The first step in utilizing the transitional probability matrix method is to develop rules for assigning saplings to the canopy tree that they are most likely to replace. Saplings under a single canopy are assigned to that canopy individual; saplings that are beneath overlapping canopies, or in gaps, are assigned to the nearest tree.

Tasks
1. Assign the saplings in your transect to canopy individuals.
2. Share your data with that from the other lab groups to obtain a "raw data matrix" for the whole sample plot. If for example you have a population of 13 alder, 5 fir, and 2 hemlock canopy trees in the plot, and 3 alder, 5 fir and 36 hemlock saplings, they may be assigned to canopy trees as in the example below:
saplings
| CANOPY TREES |
(#)
|
alder
|
douglas-fir
|
hemlock
|
sum
|
| ALDER |
(13)
|
2
|
4
|
14
|
20
|
| DOUGLAS-FIR |
(5)
|
1
|
1
|
8
|
10
|
| HEMLOCK |
(2)
|
0
|
0
|
14
|
14
|
We can derive a 'transitional probability' matrix from the raw data matrix, which represents the likelihood of one species replacing another. The probabilities are calculated by dividing the number of saplings of one species by the total population of saplings under that canopy species. In the example above alder has a 2/20=0.1 chance of replacing itself; fir has a 4/20=0.2 probability of replacing alders in the canopy, and hemlock has a 14/20=0.7 probability of replacing alders. The transitional probability matrix for the plot is:
REPLACEMENT TREES
| CANOPY TREES |
ALDER
|
DOUGLAS-FIR
|
HEMLOCK
|
| ALDER |
0.1
|
0.2
|
0.7
|
| DOUGLAS-FIR |
0.1
|
0.1
|
0.8
|
| HEMLOCK |
0
|
0
|
1.0
|
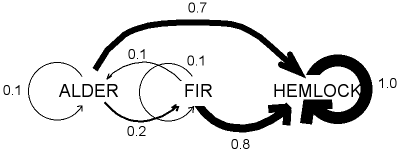
The successional trajectory for this example (an example of a Markov chain process) looks like this:

The Markov chain shows the pattern of replacement. In the example, hemlock preferentially replaces the other species and is thereafter self-replacing until the forest is disturbed.
The future abundance of any species in a plot with a stable population of canopy trees (13+5+2 = 20 trees in the example)* is given by simple matrix multiplication, with the initial structure of 13 alders, 5 firs and 2 hemlocks as the first generation (GEN1):
| SPECIES |
GEN1
|
calculation
|
GEN2
|
| ALDER |
13
|
(13x0.1) + (5x0.1) + (2x0.0) =
|
1.8
|
| DOUGLAS-FIR |
5
|
(13x0.2) + (5x0.1) + (2x0.0) =
|
3.1
|
| HEMLOCK |
2
|
(13x0.7) + (5x0.8) + (2x1.0) =
|
15.1
|
in the next generation the following transition is predicted (tree numbers rounded to an integer):
| SPECIES |
GEN2
|
calculation
|
GEN2
|
| ALDER |
2
|
(2x0.1) + (3x0.1) + (15x0.0) =
|
0.5
|
| DOUGLAS-FIR |
3
|
(2x0.2) + (3x0.1) + (15x0.0) =
|
0.7
|
| HEMLOCK |
15
|
(2x0.7) + (3x0.8) + (15x1.0) =
|
18.8
|
4. Use this method to calculate the expected stand structure for the class plot for the next 3 generations (i.e. to GEN4 - assume a constant density of canopy trees in each generation).
REPORT
Write a brief report using the following format (grade breakdown):
1. outline your results from Tasks 1, 2 and 3 (60%)
2. discuss the future structure (and biodiversity) of the Burnaby Mountain forest in the light of the model's predictions (20%).
3. discuss the merits and limitations of the transitional probability method as a tool in forest management (20%).