TASKS
1. According to the FNA, there are four species of arborvitae in the world. Two of these species are restricted to North America, the other two (Korean arborvitae and Japanese arborvitae) are native to East Asia.
We can try to determine the evolutionary relations between these four species by measuring their morphological similarity. As an example of how to undertake a similarity analysis, Table 1 (next page) presents data on some character states of species in the genus Pseudotsuga (Douglas-fir). Utilize the descriptions given in the FNA and the material on reserve to determine what characters might be important as measures of interspecific similarity in the arborvitae. Justify your choice of characters. [8]
Character
1. _____________________
2. _____________________
3. _____________________
4. _____________________
5. _____________________
6. _____________________
7. _____________________
8. _____________________
Characters used to distinguish between species of Pseudotsuga

Comparing characters (+ = present; 0 = absent)
Characters
Species Range 1 2 3 4 5 6 7 8
menziesii N. America 0 0 + + 0 + + +
macrocarpa N. America 0 + 0 + 0 + 0 0
sinensis Asia + 0 0 + + 0 0 0
japonica Asia + 0 0 0 + 0 0 0
Resultant similarity matrix
Species
menziesii macrocarpa sinensis japonica
menziesii - 0.50 0.25 0.13
macrocarpa - 0.50 0.38
sinensis - 0.88
japonica -
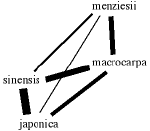
Similarity linkage diagram

2. Present your results as a table (see the example for Douglas-fir). [4]
Comparing characters (+ = present; 0 = absent)
Characters
Species Range 1 2 3 4 5 6 7 8
plicata N. America
occidentalis N. America
koraiensis Asia
standisshii Asia
3. Calculate a similarity index [S = m/(m+u)] based on these character states between each pair of species, where m = matched characters (both positive and negative) and u = unmatched characters. For example (see Table 2), four of the eight characters (#1,4,5,6) used to describe Pseudotsuga species match in the case of P. menziesii and P. macrocarpa. The similarity index between this pair is therefore 4/8 = 0.5. Present your results in the table below. [8]
plicata occidentalis koraiensis standishii
plicata
occidentalis
koraiensis
standishii
4. Present your results in diagrammatic form. The linkages in the diagram should graphically reflect the degree of similarity between species (see the example for Douglas-fir). [4]
5. Do your results give you any clues as to when (in relative terms) the isolation of the arborvitae species took place? For example, are the Asian members of the genus more akin to each other than they are to their cousins across the Pacific? [4]
Premise #2 Modern geographical distributions of species can be used to reconstruct (or speculate on) evolutionary relations and dispersal patterns in geological time.
6. The North American arborvitae are isolated on either side of the continent. Several other North American trees with close relatives in East Asia. also have disjunct distributions of this sort. Give two examples [2].
7. If this is a relatively common phenomenon, what does this suggest about the processes that led to this biogeographical pattern [4]?
Premise #3 Fossil discoveries can be used to reconstruct evolutionary pathways and biogeographical distributions.
8. Figure 3 presents you with data on the occurrence of Thuja fossils (leaves, cones, etc.) in North American Tertiary deposits. Use these data and Figure 4 to map the distribution of Thuja in North America through the Tertiary Period. [8].
9. List, in point form, the major limitations of these data sources and the resultant maps. [4]