DATA COLLECTION |
The majority of data used for this project was from the 1996 Census. I used Rob Fiedler's custom program to compile a database with all of the relevant attributes. This program also created the shapefile for the City of Vancouver Enumeration Areas. The survey I used to determine the demographics of library users showed that those aged 18-44 made up 48% of those in the 'users' category, but the 1996 breaks up age into much smaller categories (18, 19, 20-24, etc). In order to create the field that I needed for the Age criterion, I edited the table using Arcview 3.2. I simply added up the values for all age categories from 18 to 44 using the calculator in Arcview. The new field, 'Age_18_44,' can be seen below.

Edited data table
The values for the other demographic criteria (see methodology ) were readily available from the Census table I created, so no further statistical analysis was necessary to obtain them.
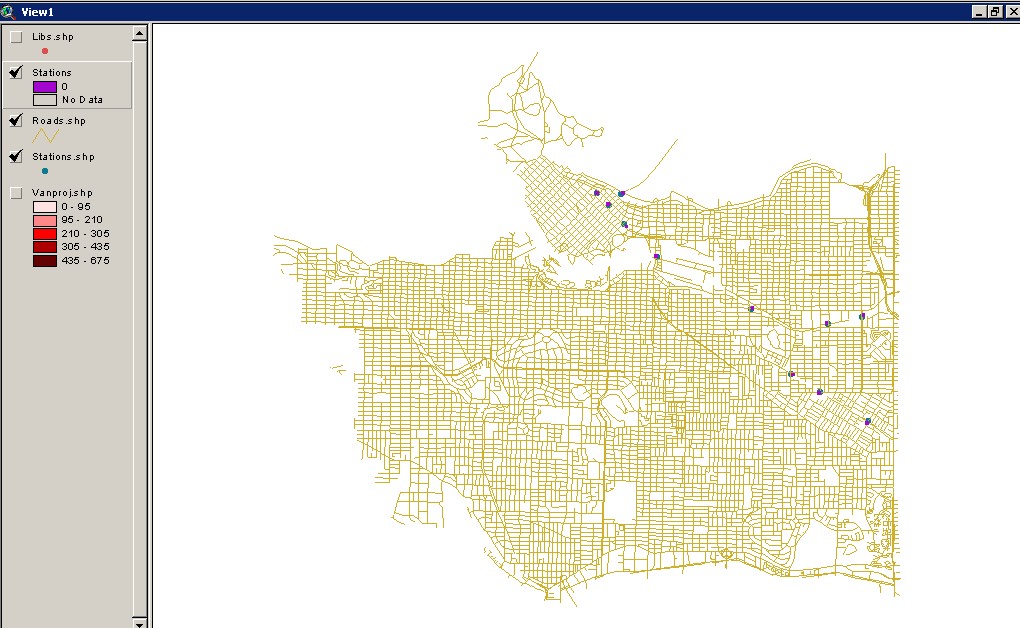
The data for public transit routes in Vancouver was obtained from the Translink folder in the SIS lab's S: drive. I opened up the theme in Arcview, then created a Grid file and exported it as an ACII file. I brought this file into Idrisi 32, resulting in a raster file.
Initially I brought the Census shapefile into Idrisi and converted it into raster, but it became quickly apparent that these were based on different projections, and because the transit theme extended outside of Vancouver, the grid cells just didn't line up. In the end, I reprojected the Census shapefile, and I was able to view the Transit and Census themes together in Arcview. From here, I created a Grid file in Arcview and exported the data to Idrisi in the same fashion as the transit theme. To create the raster maps for the different demographic variables, I opened up the Census dbf in Idrisi's database workshop and created the 6 different attribute values files. These were then assigned to the census raster file, and the demographic criteria maps were ready.
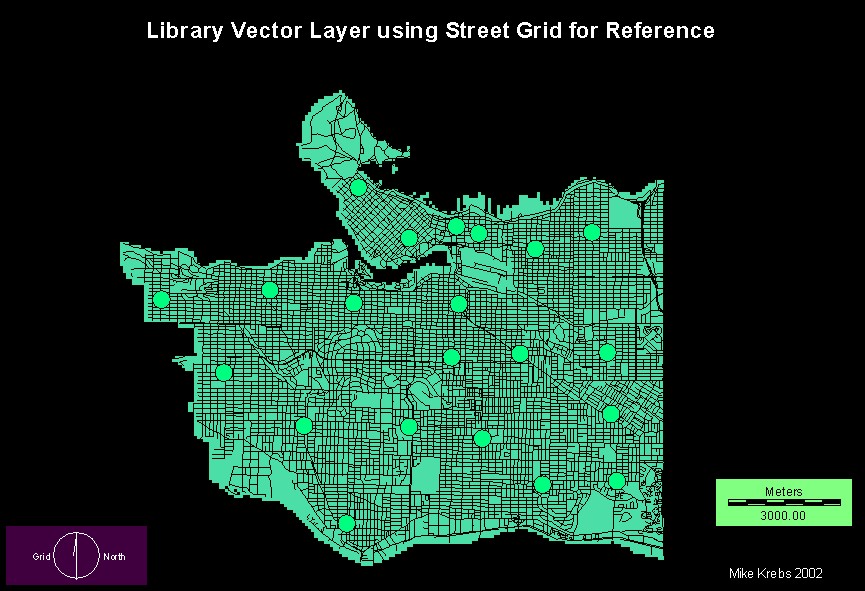
I digitized the libraries theme using a paper map showing the locations of the different branches and the roads theme as a guide. The roads data was from a dataset with all roads in BC from 2001, which I obtained from Walter Piovesan in the SFU map library. As with the census shapefile, I needed to reproject this data. I clipped the theme with Arcview's Geoprocessing Wizard using the Census shapefile as a border, then imported it into Idrisi as a vector file. Unfortunately, there was no way to know which line represented which street in Idrisi: no attributes in text format were converted. Instead, I split the screen between Arcview and Idrisi, clicking on the streets in Arcview with the 'identify' button to locate where each library needed to go, then digitizing the library location in Idrisi. Going back and forth between the paper map and the two programs was extremely tedious and time consuming. Once this was completed, I converted the Libraries vector file into raster.
I found out by chance that Arcview has a digitize extension, which would have saved a lot of time had I known this before. I created the Skytrain stations theme using this extension in Arcview, then, in the same manner as above, created a Grid file and imported the data into Idrisi to create a raster map. I already knew the location of every Skytrain station in Vancouver, but I used a TransLink map as a reference for the purposes of professionalism.