i) Production of Distance Images
Next the Boolean images of protected watershed, open water bodies, and protected parks/forests (shown in section 3.4) must be converted into a distance image type. The distance images allows additional variables such as factors and constraints that aids in the production of final images for both my spatial analysis. The distance images also are used in the production of fuzzy images which will be discussed later.
Please refer to the cartographic model of both the MCE - Boolean Overlay approach and the MCE - Weight linear Combination for the detailed requirements to produce each distance image.
The following 3 distance images were created using the DISTANCE command in Idrisi:
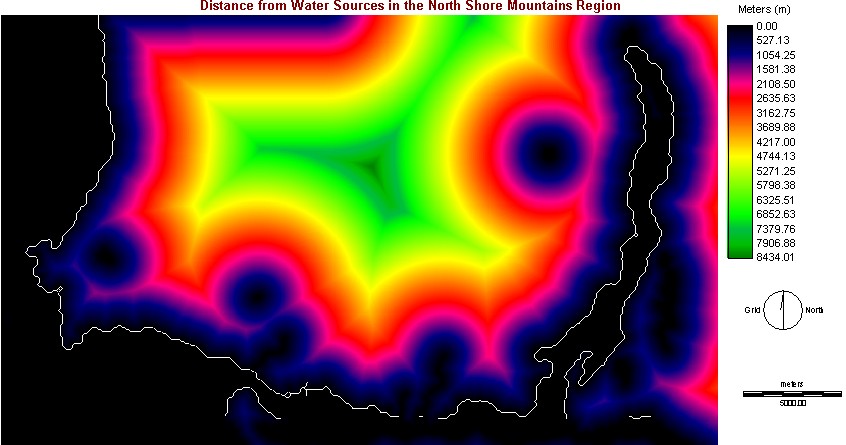
Distance Image 1: Distance from Open Water Bodies:
This involves the production of a raster image called WATERDIST.rst. The image was created by using the distance command (under the analysis - distance operators) using WATERBOOL.rst as the feature image file. According to the image below, areas indicated in black show areas that are closest towards open water body sources (not feasible for urban development). Areas indicated in green show areas that are farthest away from open water body sources (potential land for urban development?).
Image shown below is WATERDIST.rst:
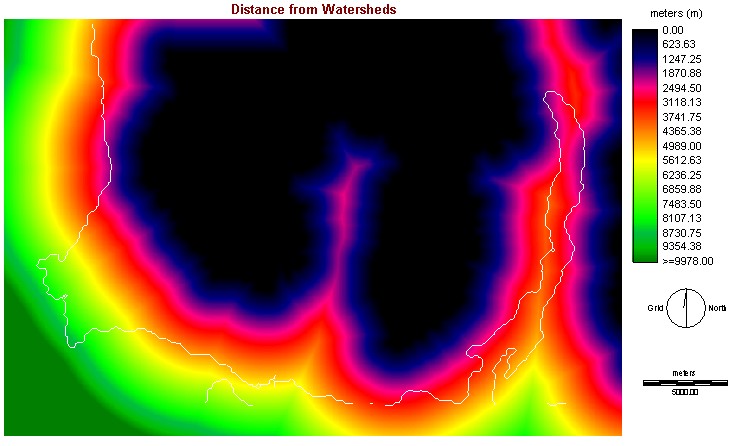
Distance Image 2: Distance from Protected Watersheds:
This involves the production of a raster image called WATERSHEDDIST.rst. The image was created by using the distance command (under the analysis - distance operators) using WATERSHEDBOOL.rst as the feature image file. According to the image below, areas indicated in black show areas that are closest towards protected watershed areas (not feasible for urban development). Areas indicated in green show areas that are farthest away from protected watershed areas (potential land for urban development?).
Image shown below is WATERSHEDDIST.rst:
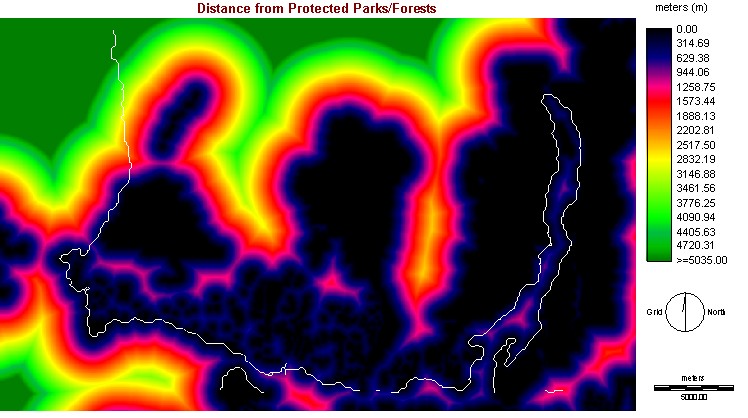
Distance Image 3: Distance from Protected Parks/Forest:
This involves the production of a raster image called FOREST_PARKDIST.rst. The image was created by using the distance command (under the analysis - distance operators) using FOREST_PARKBOOL.rst as the feature image file. According to the image below, areas indicated in black show areas that are closest towards protected forest/park areas (not feasible for urban development). Areas indicated in green show areas that are farthest away from protected forest/park areas (potential land for urban development?).
Image shown below is FOREST_PARKDIST.rst:
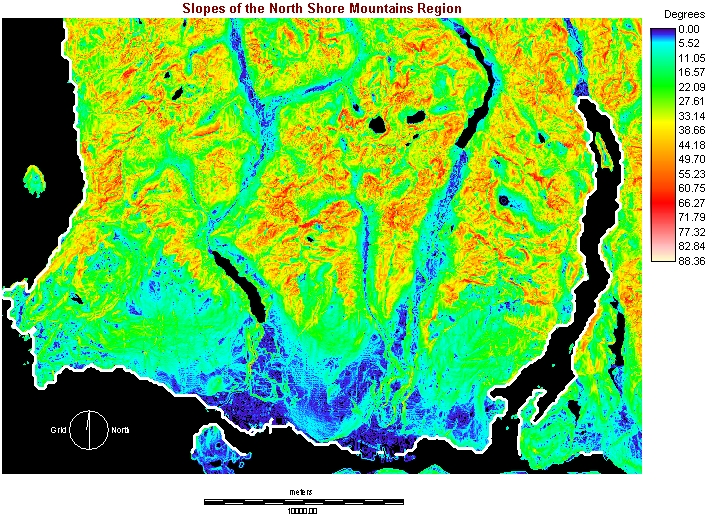
ii) Production of Slope Image
In order to enhance both the Boolean Overlay and the Weighted Linear Combination analyses, the variable of slope (in degrees) was produced using DEM_VAN.rst as the input elevation image. This is done under analysis - surface analysis - topographic variables - slope in Idrisi (I had help from Cynthia Lau to produce this image). This allows the production of distance/fuzzy images which were used later, eventually leading to the output of the final image using both methods of spatial analyses.
Please refer to the cartographic model of both the MCE - Boolean Overlay approach and the MCE - Weight linear Combination for the general requirements to produce the slope image.
According to the image below, areas indicated in green/yellow/red show areas that have a high degree of slope (not feasible for urban development). Areas indicated in blue show areas that have a low degree of slope (potential land for urban development?).
Image shown below is SLOPE.rst:
Please click here
for Spatial Analysis - Boolean Overlay Approach (4.1)
Or click here to go back to main menu