Above:
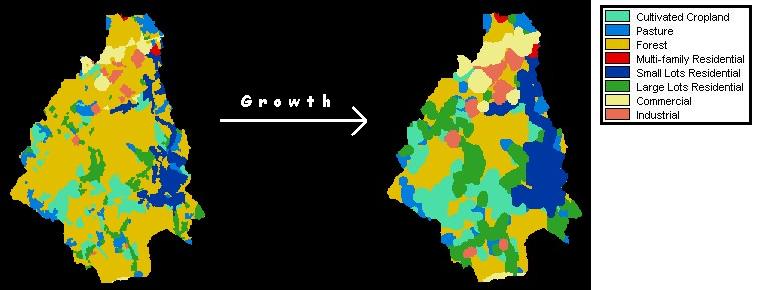
The model of future land cover scenario based on growth from the current
situation.
Cartographic Model of the Process
This scenario is meant to model possible peak flow discharge situations that may occur in the future after significant growth in the basin. In order to model future discharge, I needed to construct a future landuse layer. The resulting layer is completely hypothetical, as there is no exact method of modelling growth; however, it has been developed with some simple logic. The first assumption I made was that landuse categories would only expand from their current locations. This is not always the case but it follows the law of spatial autocorrelation, therefore it is a reasonable assumption to make. The second assumption I made was that growth exhibits linear, radial growth, simply because it is easy to model with buffers.
First, I used reclass to create separate layers for each current landuse category. Then I "grew" each category by applying a 100m buffer. Each buffer and its original area were assigned the same numeric value, the nominal identifier of that particular landuse type, so that the new layers could be recombined to form a layer representing future landuse. Due to areas of overlap between the new layers, one layer would always be covered in the overlay operations. I decided to rank the layers in the following order of priority:
commercial
multifamily
residential
industrial
small
residential lots
large
residential lots
cultivated
crop land
pasture
forest
This appeared to be a logical hierarchy. Farmland is often taken over by residential housing. Large lots often precede the subdividing and development of smaller ones. Multifamily developments often replace old industrial sites. All categories expand at the expense of the forest. The development of the future land cover layer was not a critical part of this project, but I still wanted scenario 4 to be realistic so the process used in developing it had to follow some simple logic.
Above:
The model of future land cover scenario based on growth from the current
situation.
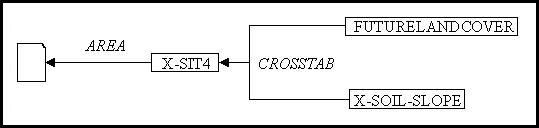
Cartographic Model of the Process
The resulting layer for future landuse was crosstabbed with the crosstabbed soil/slope layer. Areas and weighted coefficients of runoff were calculated in the same manner as the previous scenarios.
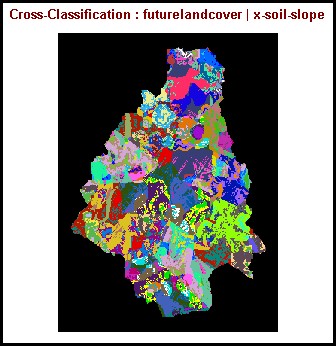
Above:
Crosstab Results
Result:
Peak Flow Discharge = 136.1
m3/s
Detailed Results