

Caudate Segmentation Evaluation (CAUSE07)
We submitted results with our multi-structure, multi-atlas variant of FS+LDDMM (currently under review) to the ongoing caudate segmentation evaluation, CAUSE07. Researchers from all over the world can download the test data, perform their caudate segmentation, and submit the results back to the website where the manual segmentations (not available to the entrants) are used to calculate a performance score.
Our scores
Our method ranked #2 overall, with an overall score of 75.99. The scores are based on an average of five scores based on the: overlap error, volume difference, average surface distance, RMS surface distance, and max surface distance. For more details please see below, and the CAUSE07 results webpage.
Volume Correlation
Also computed in the results, but not included in the scoring system, was the Pearson correlation of the volumes; our method currently has the highest correlation of all methods, with an average of 0.81. Notably, the current ranked #1 method has an average correlation of 0.17, which means the segmentations could not be used reliably in a volumetric study.
Results of the top 10 submissions,
ranked by average Pearson Correlation (as of May 24, 2009)
| Team | Submitted | Score | Position | Correlation |
| MIAL-SFU (our team) | March 12, 2009 | 75.99 | 2 | 0.81 |
| ISICAD | November 15, 2007 | 73.18 | 7 | 0.76 |
| Segmentation Team | March 10, 2009 | 75.19 | 3 | 0.70 |
| ISICAD | January 2, 2008 | 74.26 | 4 | 0.67 |
| Uath-UNC | October 23, 2007 | 71.17 | 9 | 0.65 |
| I3A(UZ) | December 11, 2007 | 74.08 | 5 | 0.57 |
| ISICAD | October 28, 2007 | 70.84 | 10 | 0.48 |
| LONI_2 | February 16, 2008 | 73.38 | 6 | 0.46 |
| ISBE Manchester | November 13, 2007 | 71.45 | 8 | 0.41 |
| ISICAD | October 7, 2008 | 79.16 | 1 | 0.17 |
Our results
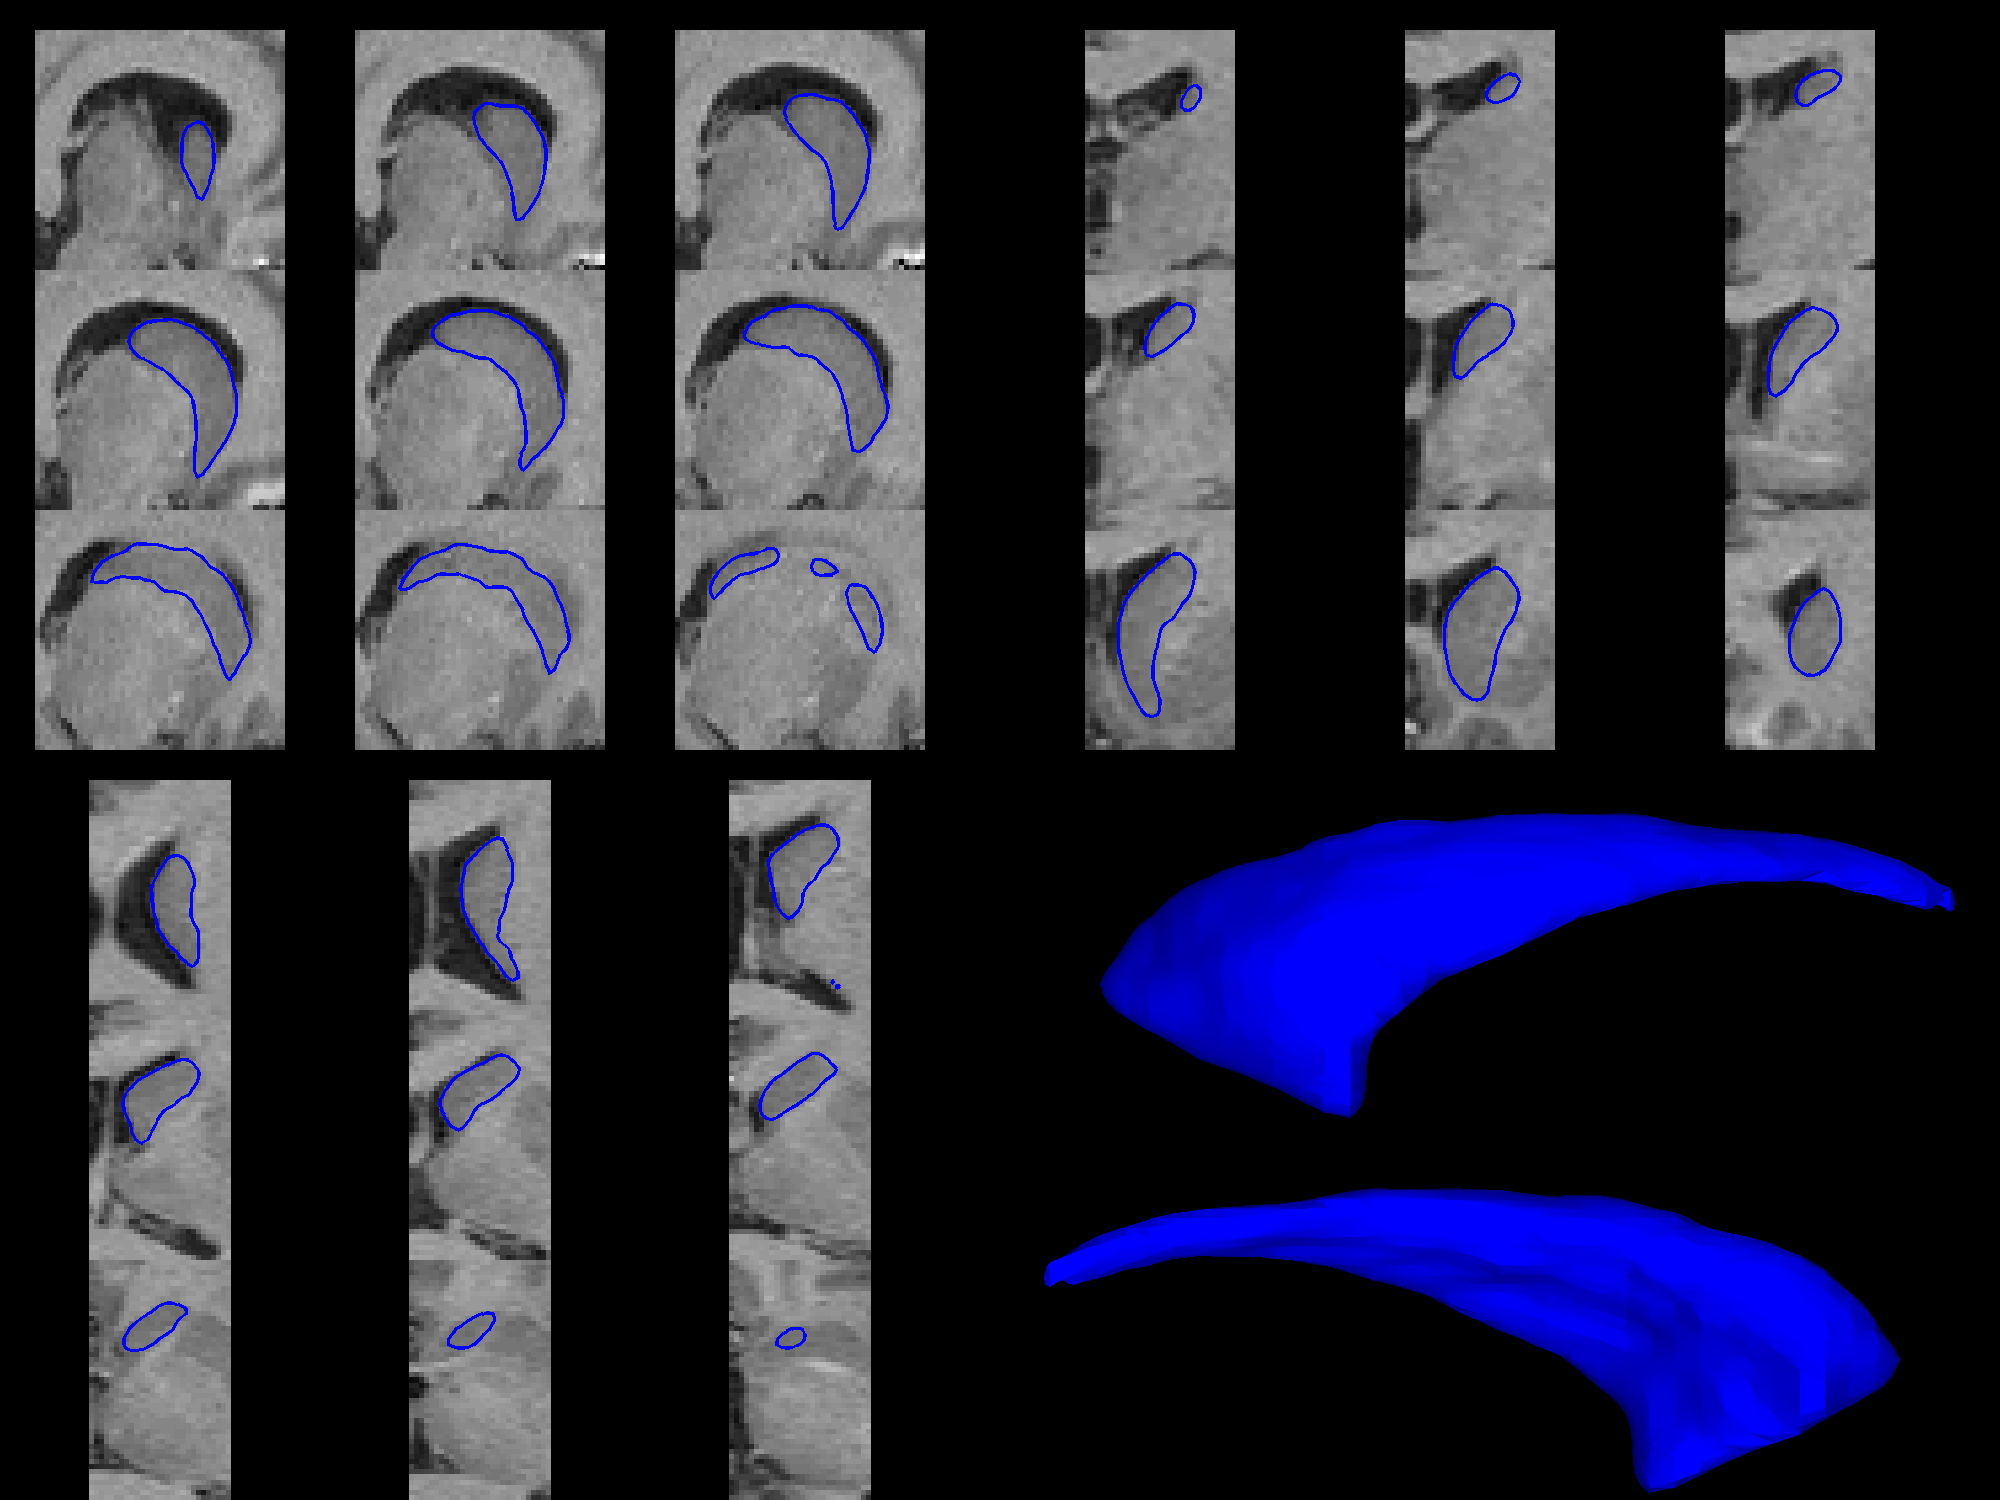
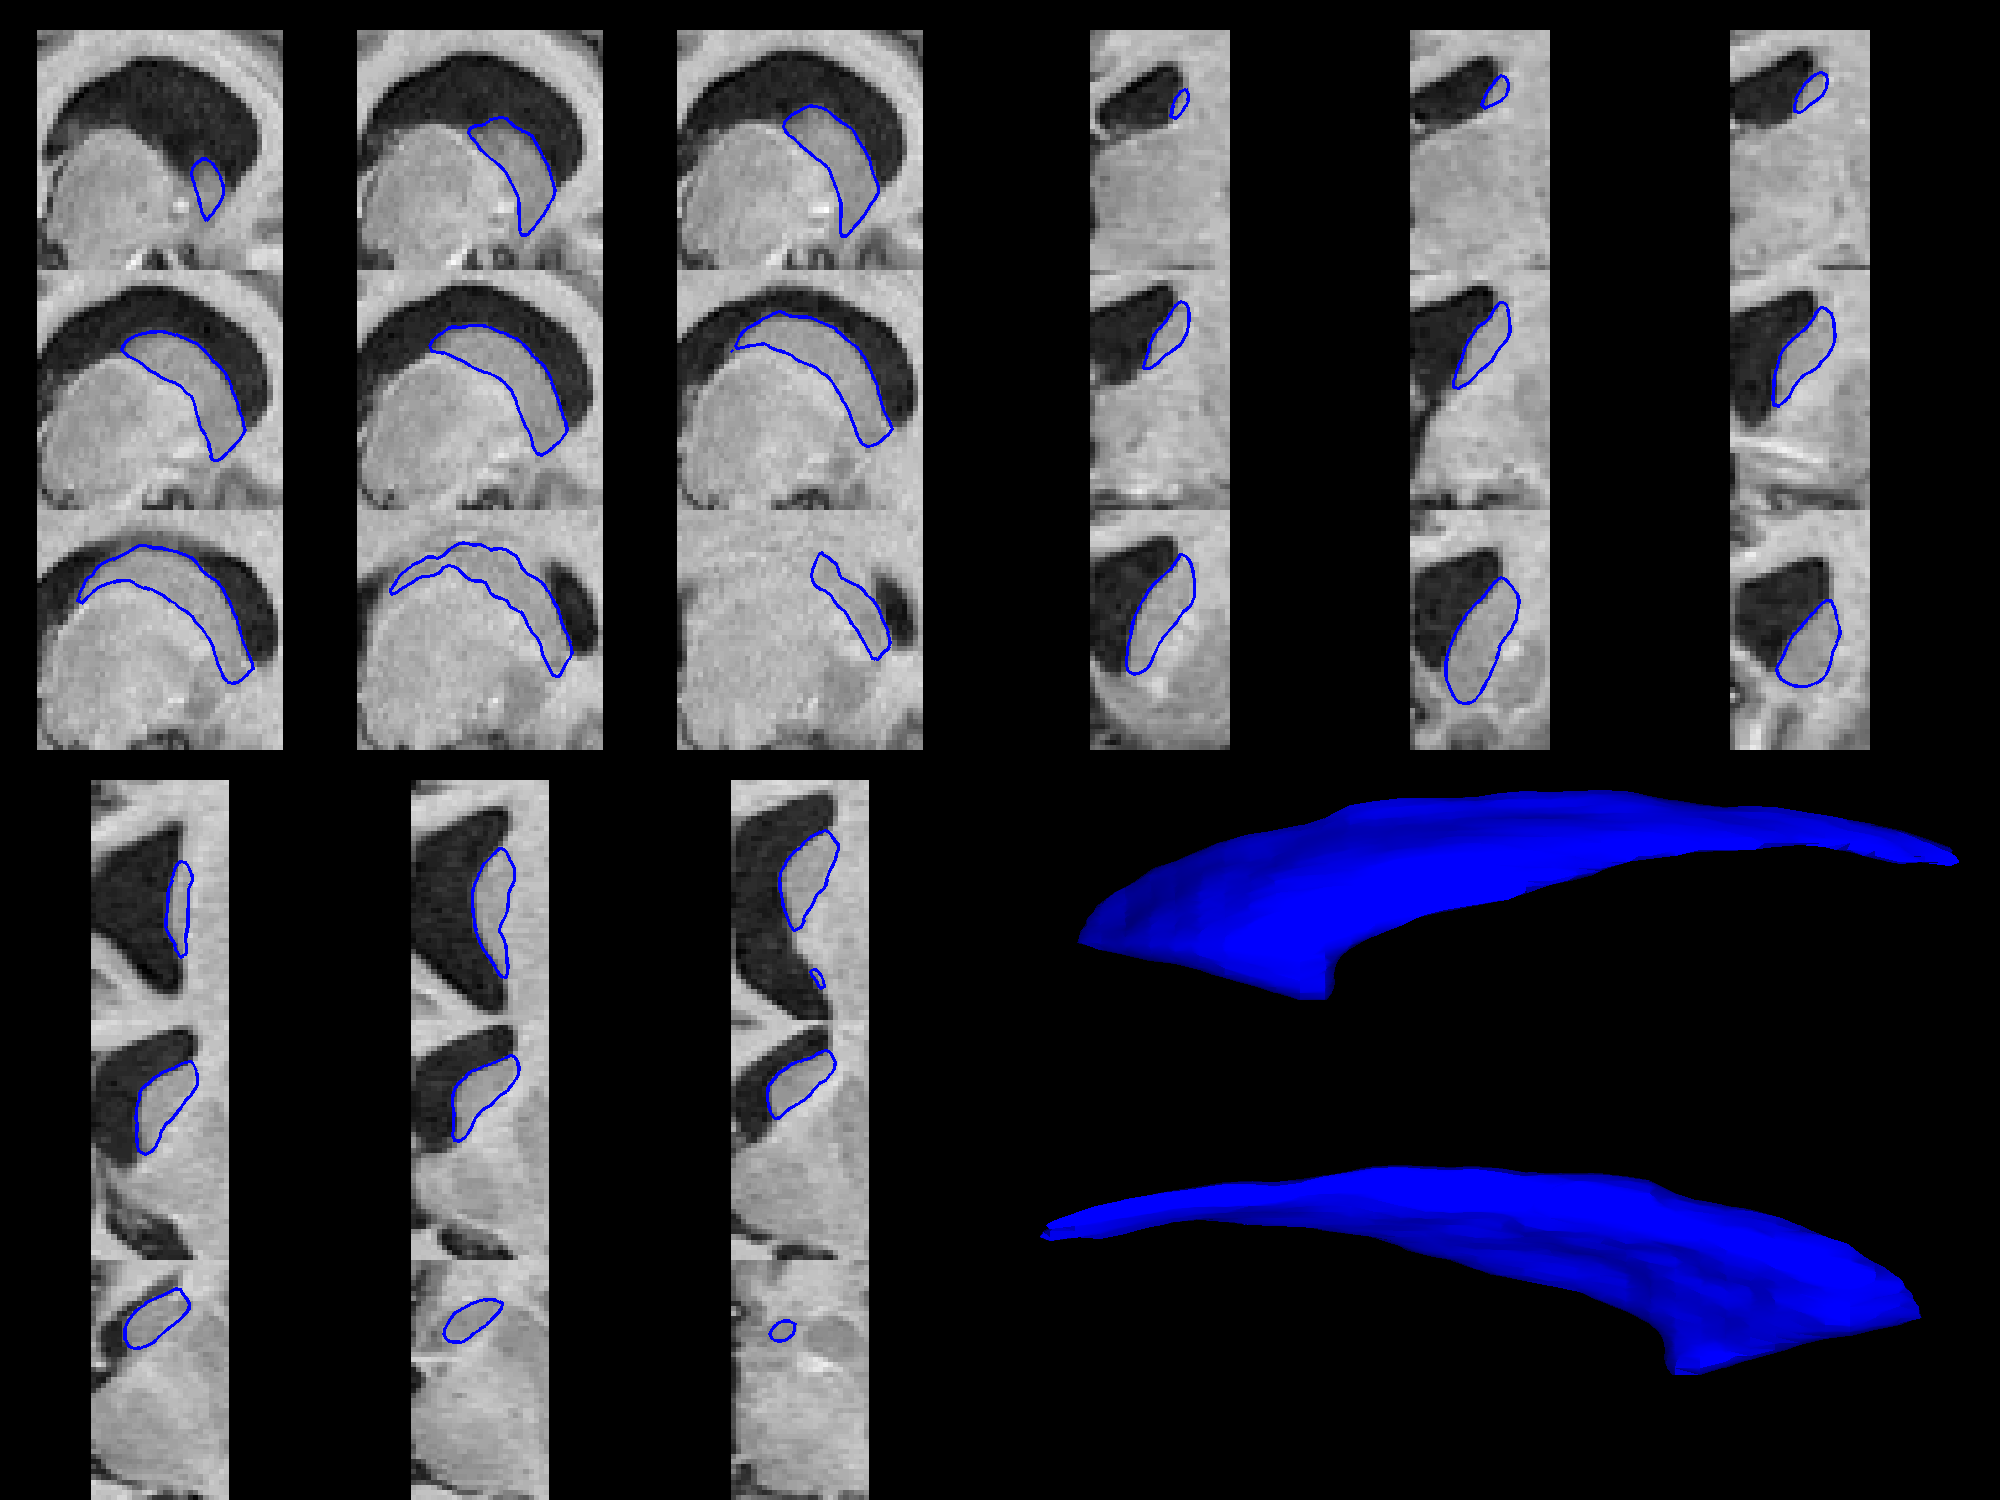
Please see below for a detailed look at our automated segmentations (prior to binarization for submission).
Test Dataset 1
Healthy controls and subjects in a Schizotypal Personality Disorder (SPD) study provided by Psychiatry Neuroimaging Laboratory at the Brigham and Women's Hospital, Boston
The manual delineations for this dataset included long and narrow caudate tails which were missed by our method for some subjects, thus explaining the low score for max surface distance.
Dataset Average Scores
| Overlap Error Score: | 85.37 |
| Volume Difference Score: | 80.44 |
| Average Surface Distance Score: | 79.28 |
| RMS Surface Distance Score: | 68.61 |
| Max Surface Distance Score: | 47.15 |
| Final Score: | 72.19 |
Left Caudate |
Right Caudate |
Subject Final Score |
 |
 |
66.21 |
 |
 |
63.65 |
 |
 |
76.55 |
 |
 |
65.61 |
 |
 |
66.65 |
 |
 |
63.89 |
 |
 |
67.08 |
 |
 |
86.51 |
 |
 |
88.81 |
 |
 |
70.58 |
 |
 |
85.13 |
 |
 |
62.16 |
 |
 |
63.56 |
 |
 |
84.26 |
Test Dataset 2
Five Pediatric (age 2-4 years) subjects provided by UNC autism research group, University of North Carolina at Chapel Hill.
Dataset Average Scores
| Overlap Error Score: | 82.42 |
| Volume Difference Score: | 84.18 |
| Average Surface Distance Score: | 78.86 |
| RMS Surface Distance Score: | 83.42 |
| Max Surface Distance Score: | 85.39 |
| Final Score: | 82.85 |
Left Caudate |
Right Caudate |
Subject Final Score |
 |
 |
77.39 |
 |
 |
85.00 |
 |
 |
87.15 |
 |
 |
80.20 |
 |
 |
84.53 |
Test Dataset 3
Five Elderly (age 60-75 years) subjects provided by UNC Parkinson research group, University of North Carolina at Chapel Hill.
Dataset Average Scores
| Overlap Error Score: | 81.60 |
| Volume Difference Score: | 72.96 |
| Average Surface Distance Score: | 78.94 |
| RMS Surface Distance Score: | 83.11 |
| Max Surface Distance Score: | 82.89 |
| Final Score: | 79.78 |
Left Caudate |
Right Caudate |
Subject Final Score |
 |
 |
77.89 |
 |
 |
81.68 |
 |
 |
82.01 |
 |
 |
78.86 |
 |
 |
78.47 |